Many people ask about snake distribution and how distribution maps are compiled.  A number of people claim to see a certain snake in a particular area and are quite disgruntled when we point out that the claimed species does not occur in that locality.

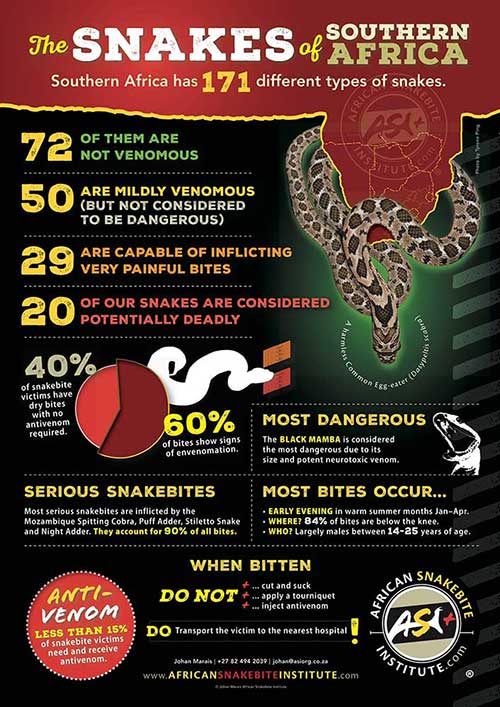
Snake identification is not easy, and many snakes are easily misidentified. Most black snakes are thought to be Black Mambas, and green snakes are thought to be Boomslang or Green Mambas. Many species have a preferred temperature range that they occupy. For example, Black Mambas prefer hot tropical bushveld or savanna. Where there are cold grasslands with frost in the winters, mambas do not generally occur there. The opposite is true for Berg Adders that prefer cooler mountain tops, often with snow in the winter. They will not be found in hot tropical bushveld. Other factors that influence distribution include humidity, altitude, vegetation, soil types and available prey.

This understanding of a species preference for habitat and climate is based on records of where the snake has been sighted and positively identified by a reptile scientist. This has allowed us to compile distribution maps.

Here’s a breakdown of the process:

  1. Data Collection

This is the foundation of a distribution map. Sources include:

  • Museum records – Historical data from preserved specimens with accurate location information. Scientists have been collecting snakes in Africa for almost 300 years. Specimens are preserved and catalogued in a museum with a location of where they were found, on what date and the name of the collector. These older records are often used to assist in building the basis of distribution maps.
  • Field observations – Notes from herpetologists and researchers during fieldwork. When researchers are on expeditions, they will often note records of all the snakes they encountered in that area. These records, if they are from a reputable researcher or provided that they are verified with photographic images, can be used when compiling distribution maps.
  • Scientific literature – Published studies, checklists, and surveys. These records extend back around 300 years with information on snake observations. They often come from areas with few records, or from conservation regions such as national parks and reserves. If you encounter a snake not known from a certain area, consider recording the observation and submitting it to a scientific journal as a  short note.  Scientific journals such as African Herp News welcome such contributions (for more details or assistance in this regard, please email snakes@asiorg.co.za).
  • Citizen science platforms –Platforms such as iNaturalist have increased their footprint in Africa and thousands of snake records are added each year. These platforms allow anyone with and interest in natural history to photograph a snake (or other living creature or plant) and upload the record with its locality onto their database. This way of crowd-sourcing information has allowed us to nearly double snake records in the last 20 years alone! If you are a snake remover or encounter snakes frequently, consider uploading your records to iNaturalist to assist with improving our knowledge of snake distributions.
  • Environmental agencies – Biodiversity and conservation records from parks or reserves. Many reserves keep a species list of what occurs on the reserve. They may also supply dead specimens to museums. Biodiversity companies that conduct environmental impact assessments for sites that are about to be developed, also publish reports on species observed during their surveys.
  1. Data Validation

Raw sightings need verification to ensure that they are accurate:

  • Correct species identification is crucial (photos, expert review). In museum collections we have experts that scrutinise collections to positively identify specimens. This is done by counting various scales on the body, belly, tail and head. For platforms like iNaturalist, the community agrees on an identification and can add information or opinions to support such identification.
  • Accurate locations are checked using GPS devices or map references. Many of the earlier localities may be quite vague with location such as “east of Port Natal”. These records are largely ignored as they are too vague. Before GPS technology, many records would indicate distance and direction from a major town or city or give the name of the farm.
  • Outliers may be flagged or excluded if they seem unlikely or unverified. Many of the early specimens collected in Africa were poorly labelled and either had errors (often confusing Africa with the Americas) or only gave the location of the port that the specimen was exported from. Many of the southern African snake specimens were exported from the Cape of Good Hope – Cape Town, even if they were collected further inland – and therefore many species are called “capensis – originating from the Cape” even though the snake may not occur in the Cape.
  1. Mapping Techniques

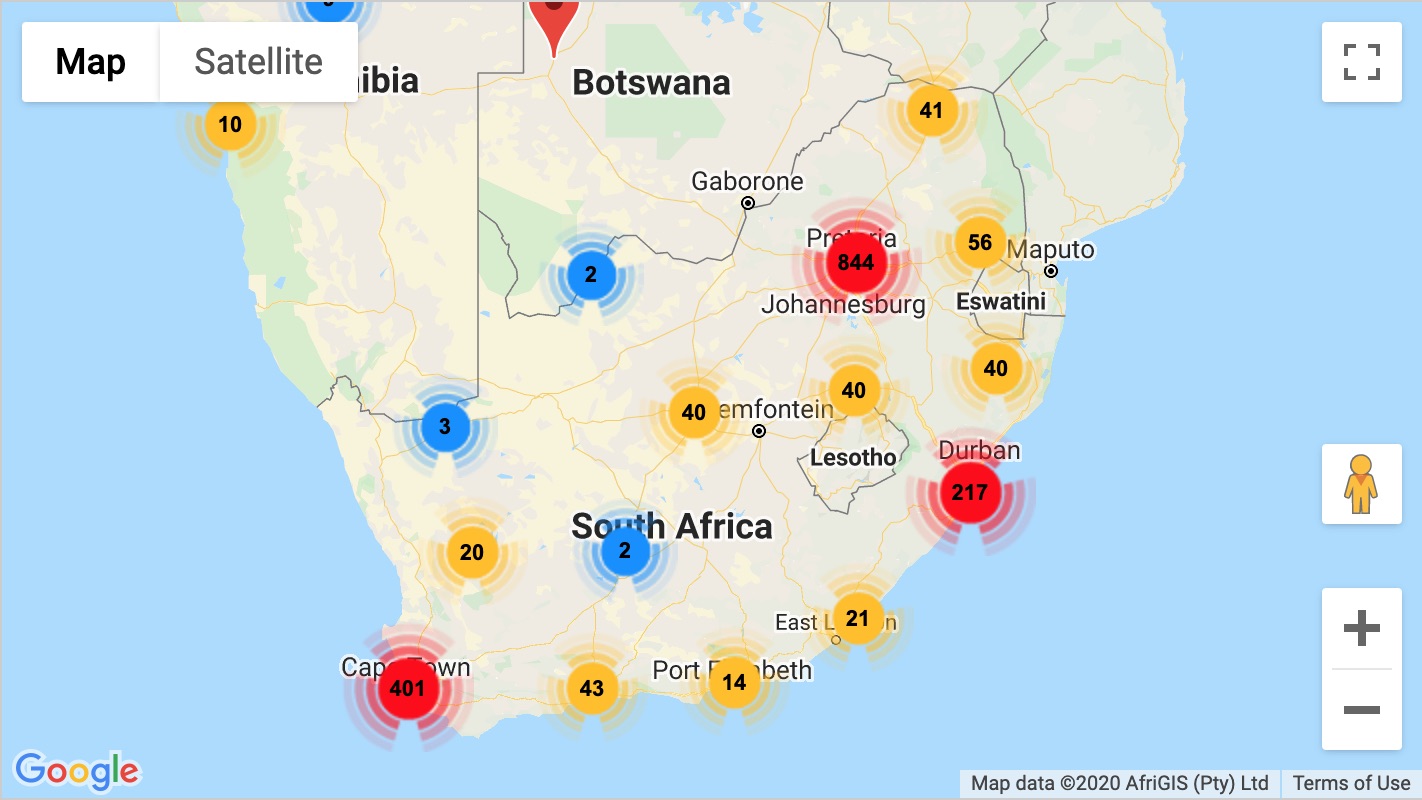
Once reliable data points are gathered, mapping begins. This usually incorporates using some ecological data points such as geology, temperatures, rainfall, biome, habitat and elevation. We can then compile predictive maps for where a species should occur based on all these data that match where the species has been found. These are simple maps and may not be extremely accurate but give a very good general indication of where a species occurs. As more distributional records of snakes come available, the maps are updated. For example, Brown Forest Cobras (Naja subfulva) were thought to only occur in coastal KwaZulu-Natal extending into Mozambique and just entering the montane forests of Eastern Zimbabwe. However, in recent years a some observations have been made around Pafuri in northern Kruger National Park and the eastern Soutpansberg mountains where individuals were seen and photographed. This species was overlooked in these areas for many years. The maps now include these regions as being part of the distribution of this snake.

Final Use

Distribution maps are incredibly useful when making identifications and many species can be eliminated as they don’t occur in an area where the observation was made. These maps are commonly used in:

  • Field guides
  • Conservation planning
  • Risk assessments (e.g. for antivenom supply or medical planning)
  • Education and public awareness

So, although the maps are always a work in progress, they are based on scientific data and are not just a guess of where a species occurs. As more observations of snakes are made, the maps are improved and we have a better understanding of the distribution of a species. Finding a snake well out of range, especially large cobras or mambas, is unlikely and we are often told of Green Mambas occurring in the Kruger National Park, Mpumalanga or even Limpopo. They do not occur there.

Map indicating the distribution of the Puff Adder (Bitis arietans) in Africa
Map indicating the distribution of the Puff Adder (Bitis arietans) in Africa.
African Snakebite Institute